
This guide is written for someone brand new—someone smart, but unfamiliar with BloomSignals’ workflow. It answers the exact “wait…when do I enter?” and “what am I looking at?” questions that come up in the first week.
Reference example: Daily ticker article

Timeline
Coreopsis is a swing-trade workflow with a Day 1: afternoon entry window. That would be Day 1 → 2026-03-04 (reference article)
The trading-day rhythm
- Day 0 – Evening (after market close): tomorrow’s tickers Today's Sheet + Article pages are published.
- Day 1 – Next day: you watch the open and morning trend develop.
- Entry window: 12:00 PM ET → market close
- Hold horizon: typically 3–7 trading days, managed by your plan (targets, stops, protections).
Key point: You are not entering at the open by default. The model expects you to wait, observe the morning structure, then enter (or skip) in the afternoon.
What you’re looking at on a ticker page
Each ticker page is a decision aid. It’s not just “here’s a stock.” It’s structured to answer:
- Direction: LONG or SHORT bias
- Scenario quality: Prime / Trend / Scout
- Execution plan: Entry band, stop, targets, and Day 2 protections
The three most important sections you’ll use daily:
Bloom Profile
A visualization of model predictions across a grid of conditions (gap, morning-trend)
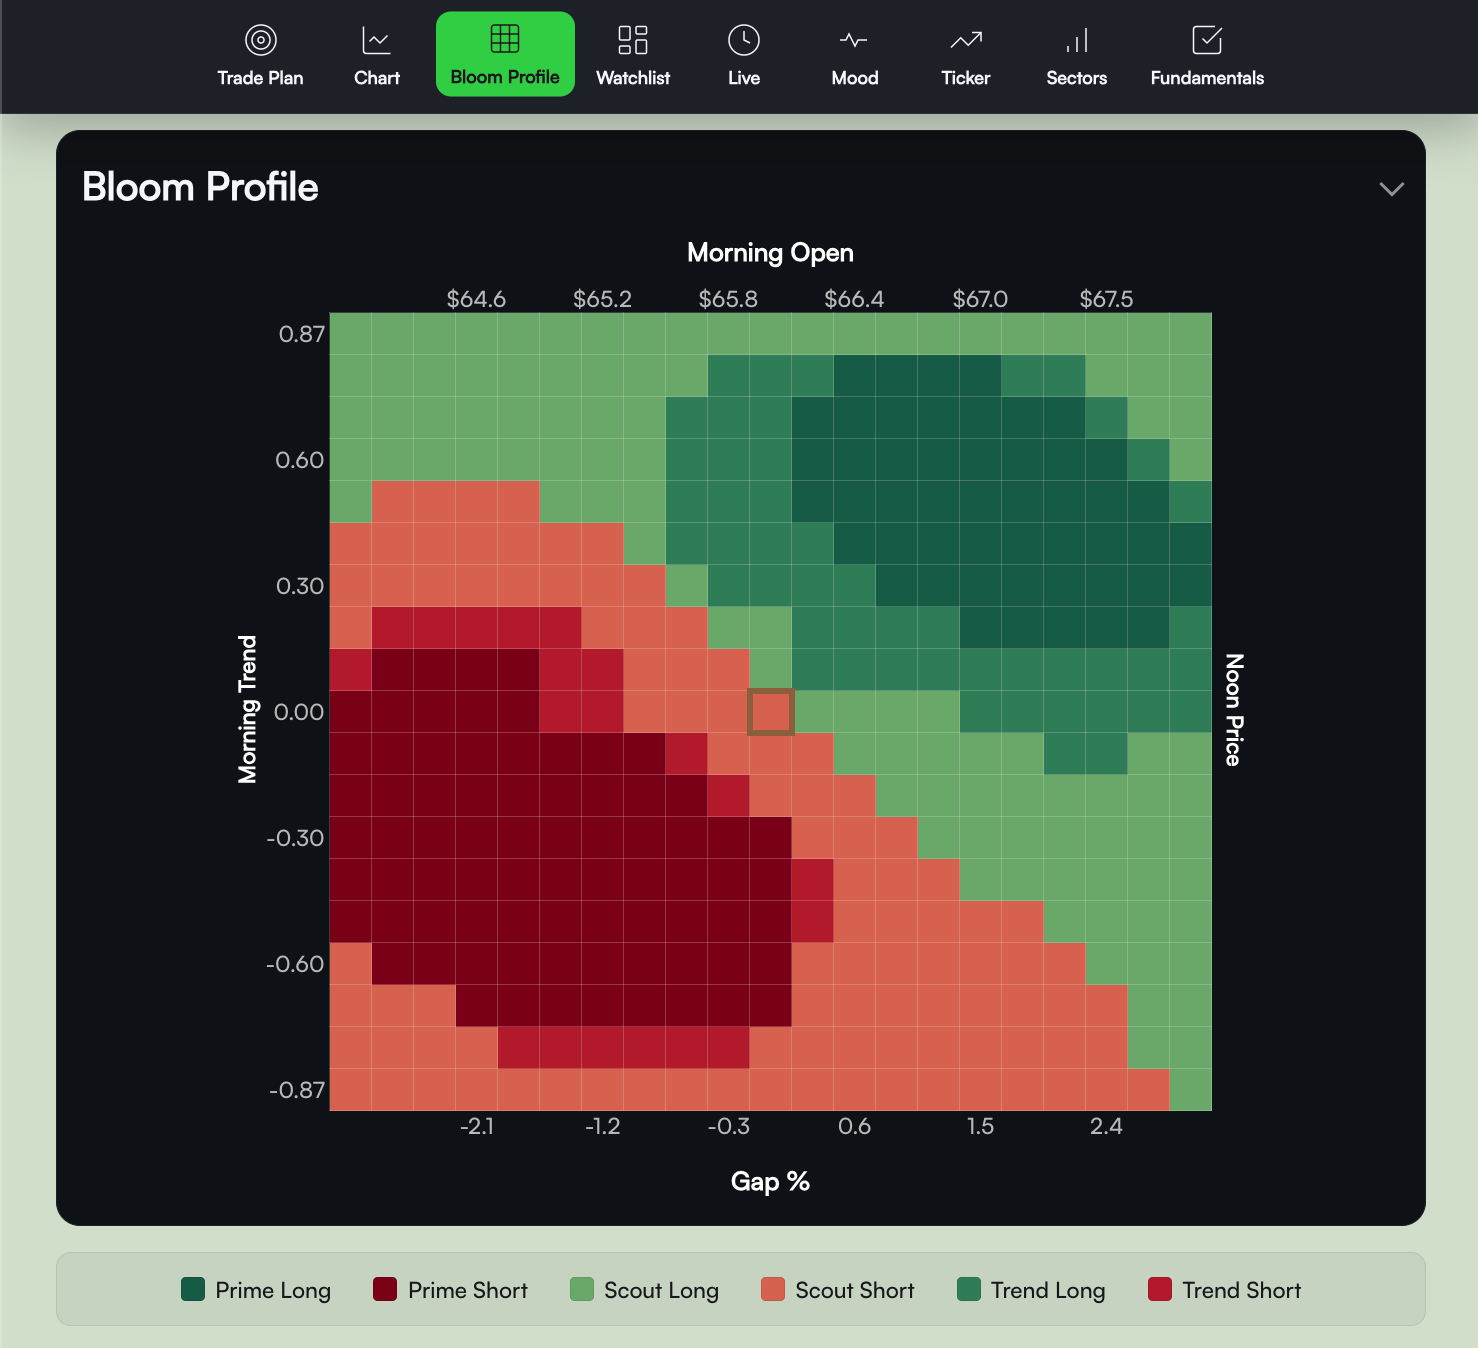
BBY- The grid’s axes correspond to gap and morning trend / noon context.
- Each cell represents “If today’s conditions look like this, then the model’s expected outcome is that.”
This is why it can look “conditional”— the model isn’t claiming “BBY will go up tomorrow.” It’s saying: if the morning develops in a specific way, then the afternoon entry/plan has historically favorable behavior.
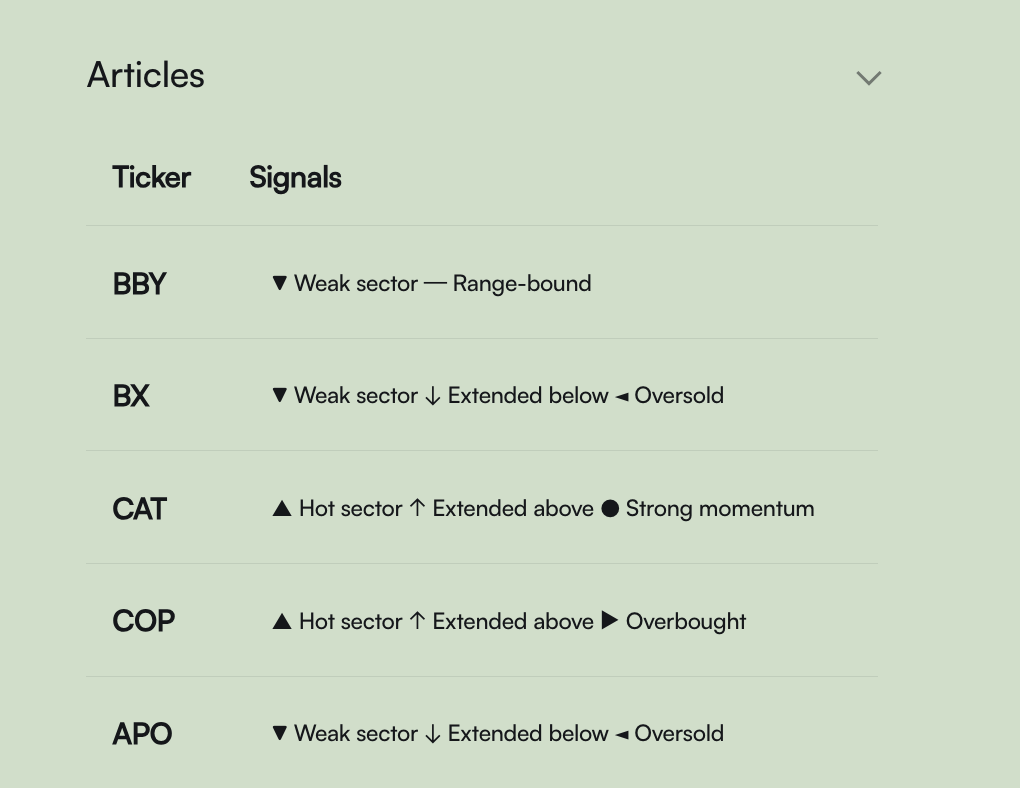
Watchlist table
the numbers behind the Bloom Profile
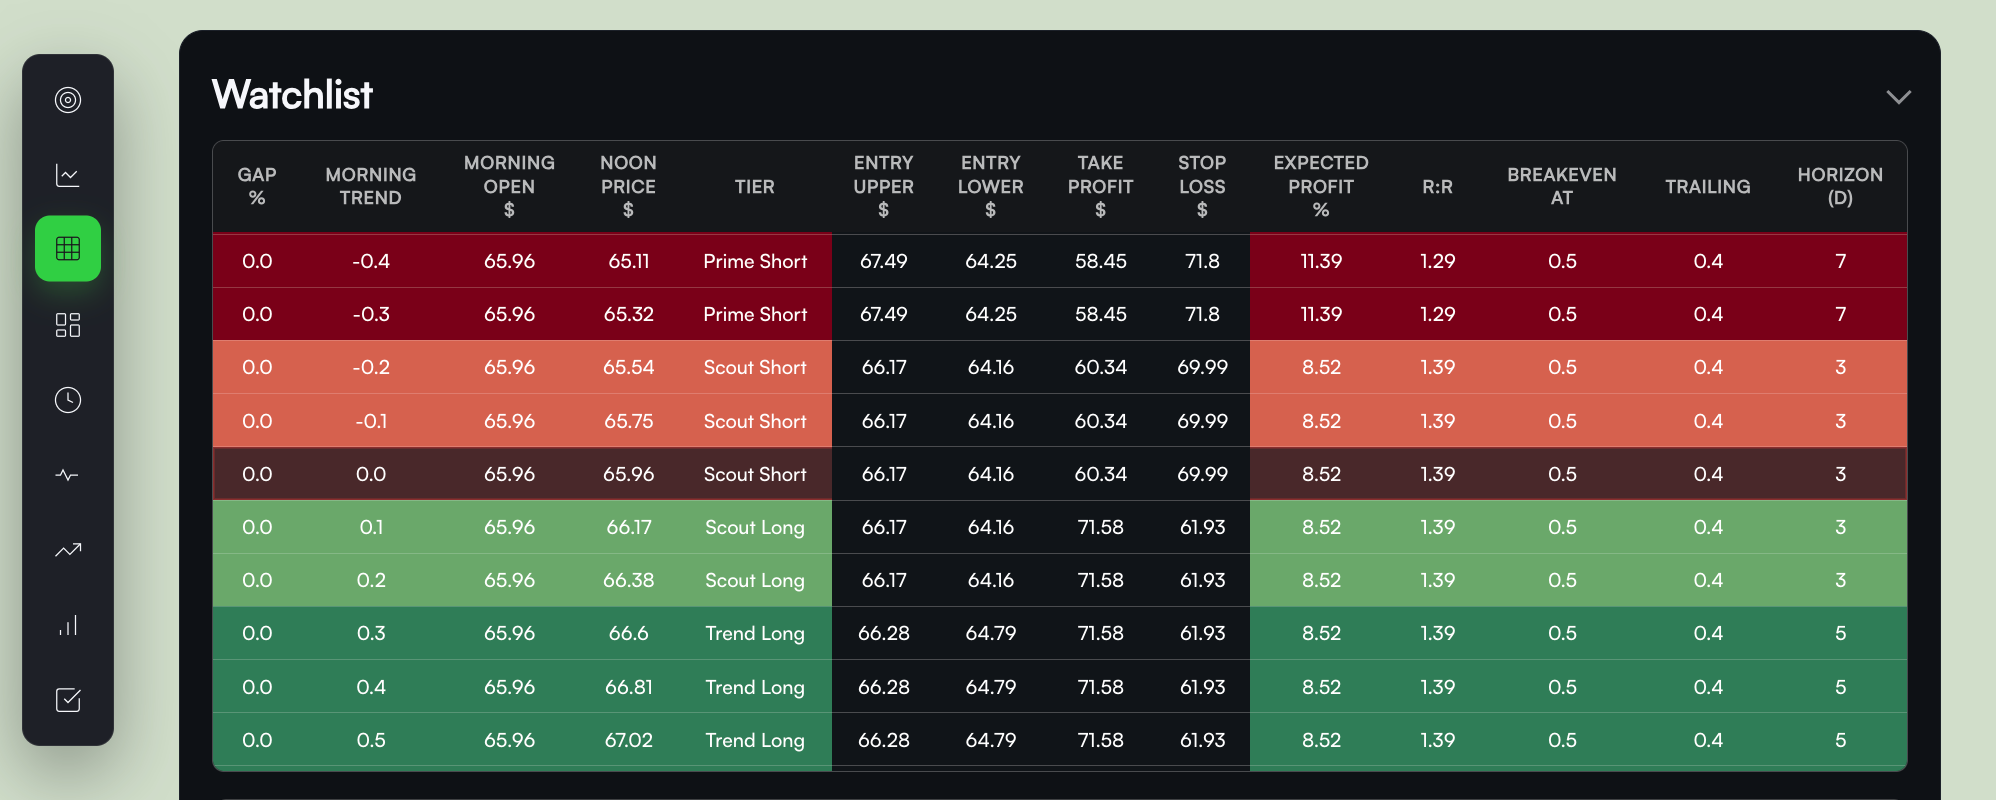
BBYThink of the watchlist table as the Bloom Profile, but in pure numeric form—the same grid, expressed as rows/values.
- It’s where you’ll find Entry Lower / Entry Upper (bounds of recommended Entry), TP (take-profit), SL (stop-loss), and R:R (reward vs. risk); tied to specific conditions.
- Important nuance: bins are ticker-specific and not necessarily evenly spaced.
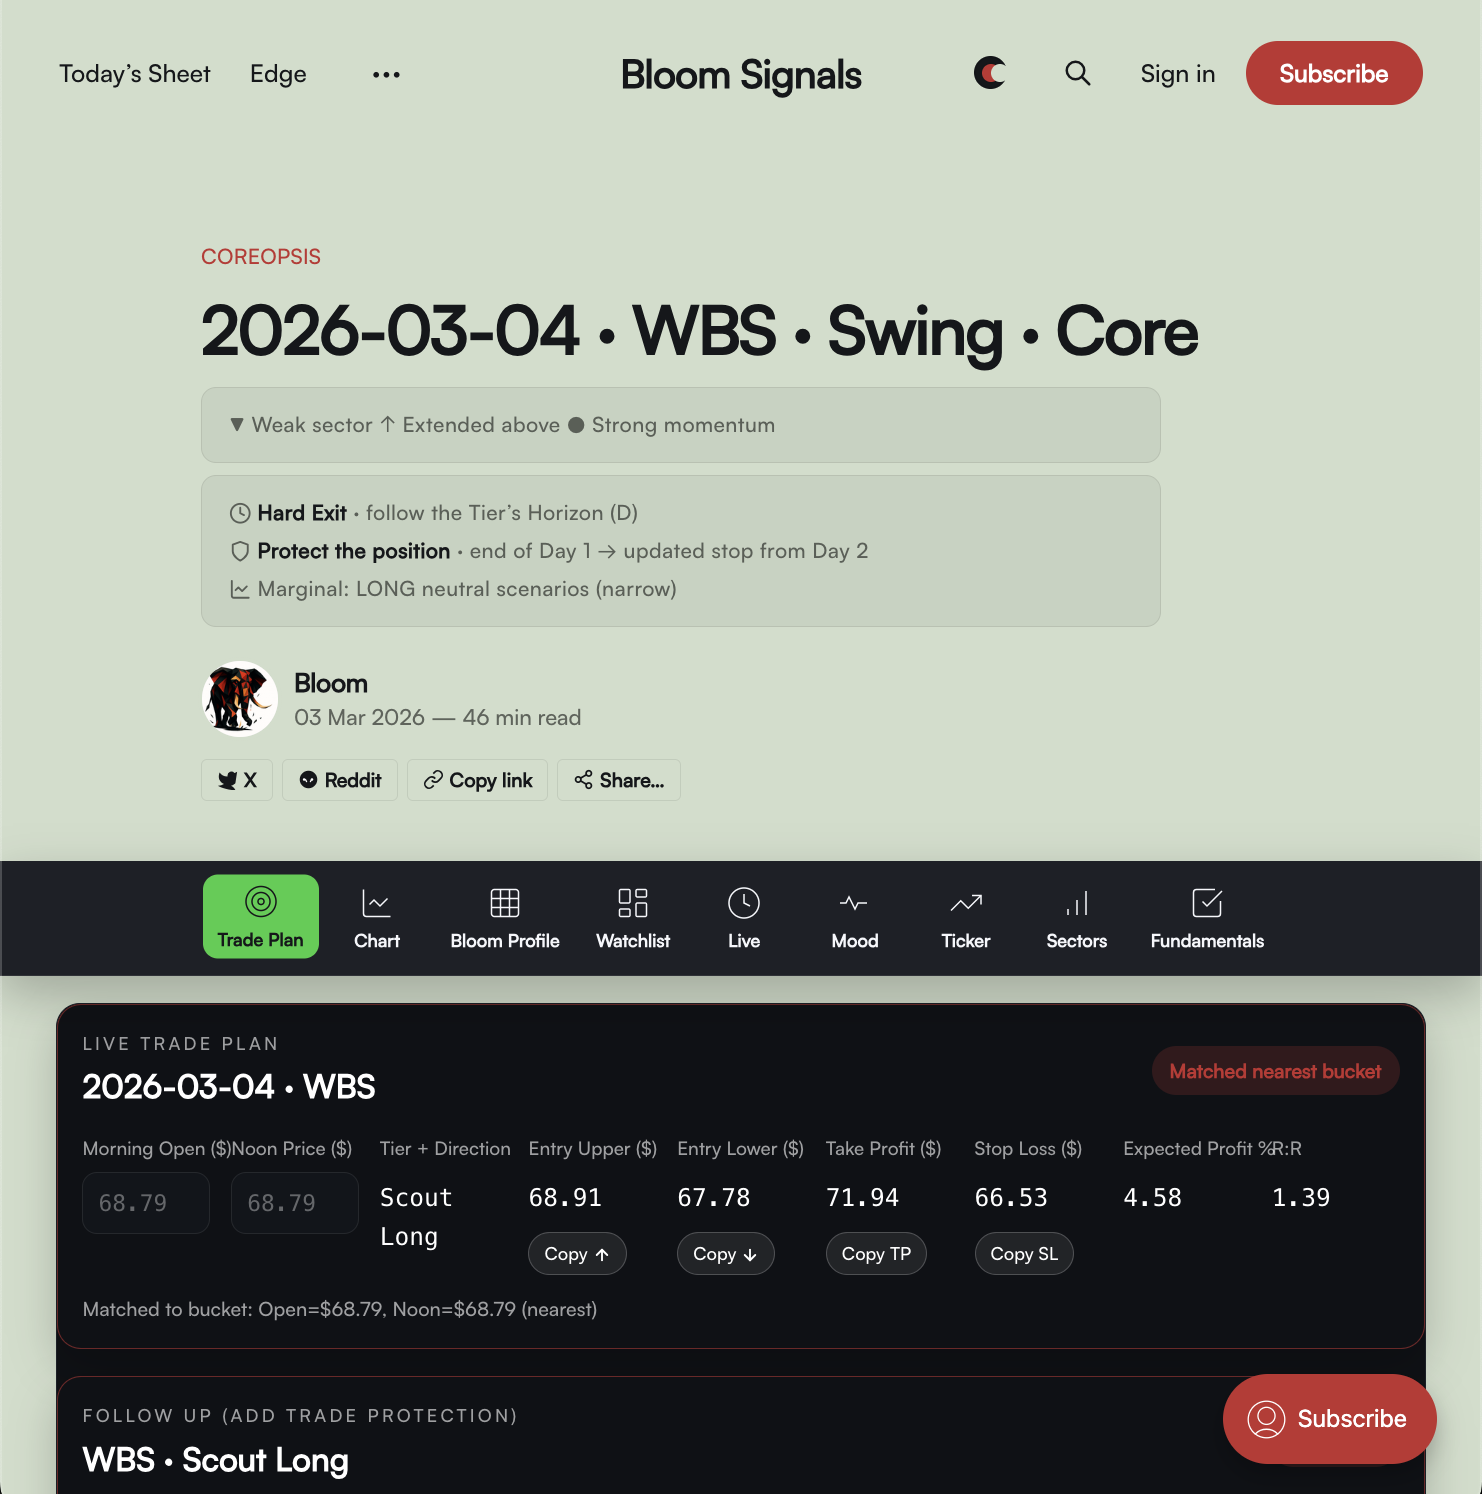
Live Trade Plan & Follow-Up widgets
These widgets are not “live”. They exist to help find scenarios quickly and to help with rolling protection calculations.
BBYThis trips people up:
- The ticker article is static (it won’t auto-update as the market moves).
- The widgets are there to save you time—so you don’t have to hunt through the heatmap/table manually.
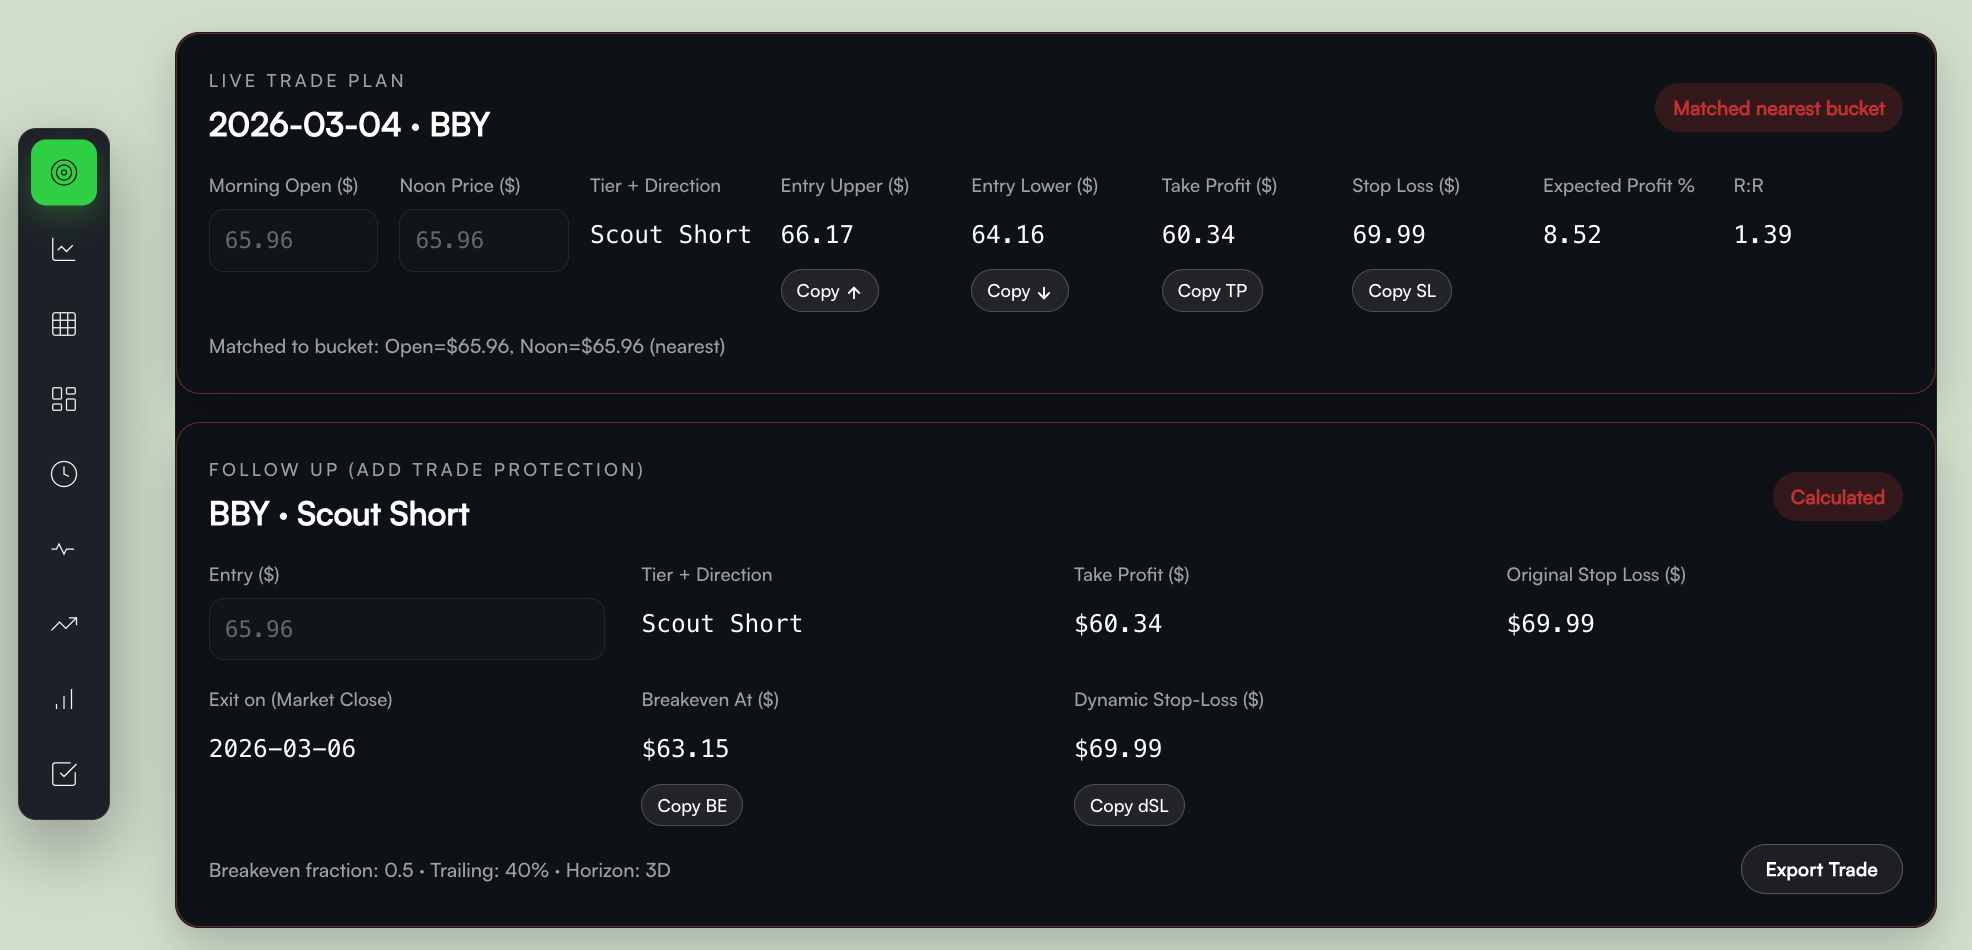
How it actually works:
- You observe the open/morning.
- Around noon, you manually enter the key values into the widget.
- The widget then highlights the corresponding “brown square / row” so you can see exactly which heatmap cell / table row generated the plan.
So yes: manual input at noon → automatic lookup/mapping → you get the correct scenario + levels without searching.
Scenarios: ACTION and STAGING
Every ticker has a recommended scenario, composed of:
ACTION
- LONG or SHORT (directional bias)
STAGING (risk category)
- Prime → Trend → Scout (ordinal risk categories)
These are not marketing names. They are risk buckets.
- Prime: best risk profile (typically tighter invalidation / cleaner behavior), but rare
- Trend: solid, more common, trades with trend-follow-through behavior
- Scout: more conditional / higher variance; can work well but often needs more discretion and respect for protections
Practical interpretation:
Prime is “highest quality conditions.” Trend/Scout happen more often; the model still provides a plan, but your execution discipline matters more.
How to trade the ticker article (daily routine)
This is the simplest workflow that matches how Coreopsis is designed.
Step 1 — Night before / early morning: shortlist
Open “Today’s Sheet” (Coreopsis watchlist) and pick 2–5 tickers you’re willing to trade.
- You’re selecting for liquidity, familiarity, sector exposure, and focus.
- Do not try to trade everything.
Step 2 — Morning: observe only
Day 1: Between the open and noon:
- Watch price behavior relative to the article context
- Note whether the open is clean or messy
- Avoid forcing entries early
This is the period where the day’s condition “chooses” a cell in the Bloom Profile grid.
Step 3 — Noon: choose the correct cell (using the widget)
Around noon:
- Enter the needed values into the widget (manual input)
- Confirm the widget highlights the correct heatmap cell / table row
- Read off the plan: Entry Lower/Upper, TP(s), SL, protections
Step 4 — Day 1 afternoon: enter or skip
You only enter if price trades into the Entry Zone between noon and close.
- If price never reaches the entry band → the action is effectively NO ENTRY
- Do not chase outside the band. That breaks the assumptions behind the plan.
Step 5 — Day 2: setup protection before the open
Before market open on Day 2:
- Apply “protections” (breakeven logic, dynamic stop guidance)
- Adjust based on where you were actually filled within the Entry Zone
The Follow Up widget helps here once you have a real entry price.
Cheatsheet:
- Entry timing: Coreopsis entries are evaluated and taken from 12:00 PM ET → close on Day 1.
- Conditional model: The Bloom Profile predicts outcomes across a grid of (gap, morning-trend). You select the cell that matches today.
- Widgets are helpers: Ticker pages are static; you manually input noon values and the widget maps you to the correct recommendation.
Checkout this article for FAQs: